
How do you choose COLOUR in your reports and graphs?
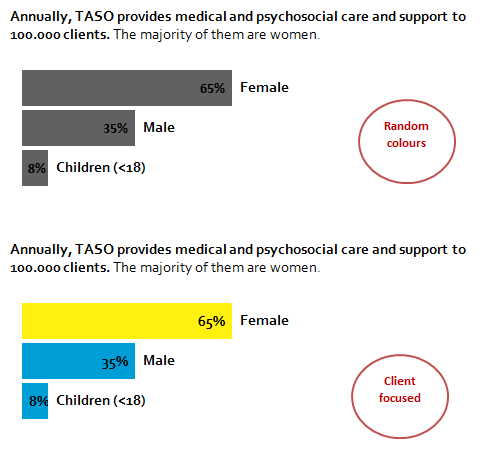
There are two options: you can either decide to choose colour randomly using the programmes default colour schemes, or you can let your CLIENT’S COLOUR SCHEME guide you in your choice.
![]() Example: ECD project is currently facilitating an Evaluation Practice Project. Two ToT evaluators are carrying out an evaluation for TASO (The AIDS Support Organisation). Let me use this example to show the effects of client-focused colour choice on your graphs, and ultimately, on the quality of your presentations.
Example: ECD project is currently facilitating an Evaluation Practice Project. Two ToT evaluators are carrying out an evaluation for TASO (The AIDS Support Organisation). Let me use this example to show the effects of client-focused colour choice on your graphs, and ultimately, on the quality of your presentations.
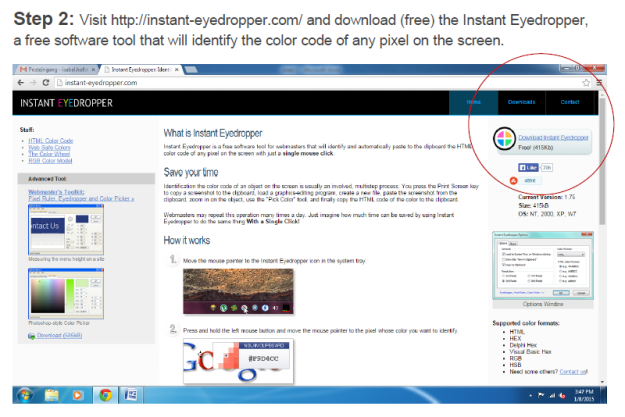
Read further for a Step by Step guide on how to identify your clients’ colour codes and how to use them for your visualisations/reports. You can also download it from our Materials page.


Car video games entice individuals coming from all
ages, from quite younger champ man 15 hack children to those of fairly advanced years https://math-problem-solver.com/ .
Flavonols are part of the chemical substances, known as polyphenols that improve
the blood flow through the mind.
Pingback: Ann's Blog | How to Place Labels Directly on Top of Your Line Graph
Pingback: EERS Week: Ann K. Emery on Overhauling Your Organization’s Data Visualizations? Three Edits Guaranteed to Give You the Biggest Bang for Your Buck · AEA365